By Victor Augusteo, CTO, Boon AI
Construction technology has a credibility problem.
Every vendor says their tool is “AI-powered.” Every pitch deck shows time savings. But talk to any estimator who has tried one of these tools, and the first thing they’ll say is: “Yeah, but was it right?”
That question, the accuracy question, is the single hardest problem in construction AI. And it’s the one most companies avoid answering with real numbers.
We didn’t avoid it. We measured it. And the story of how those numbers moved tells you everything about where this industry is heading.
The Accuracy Threshold Nobody Talks About
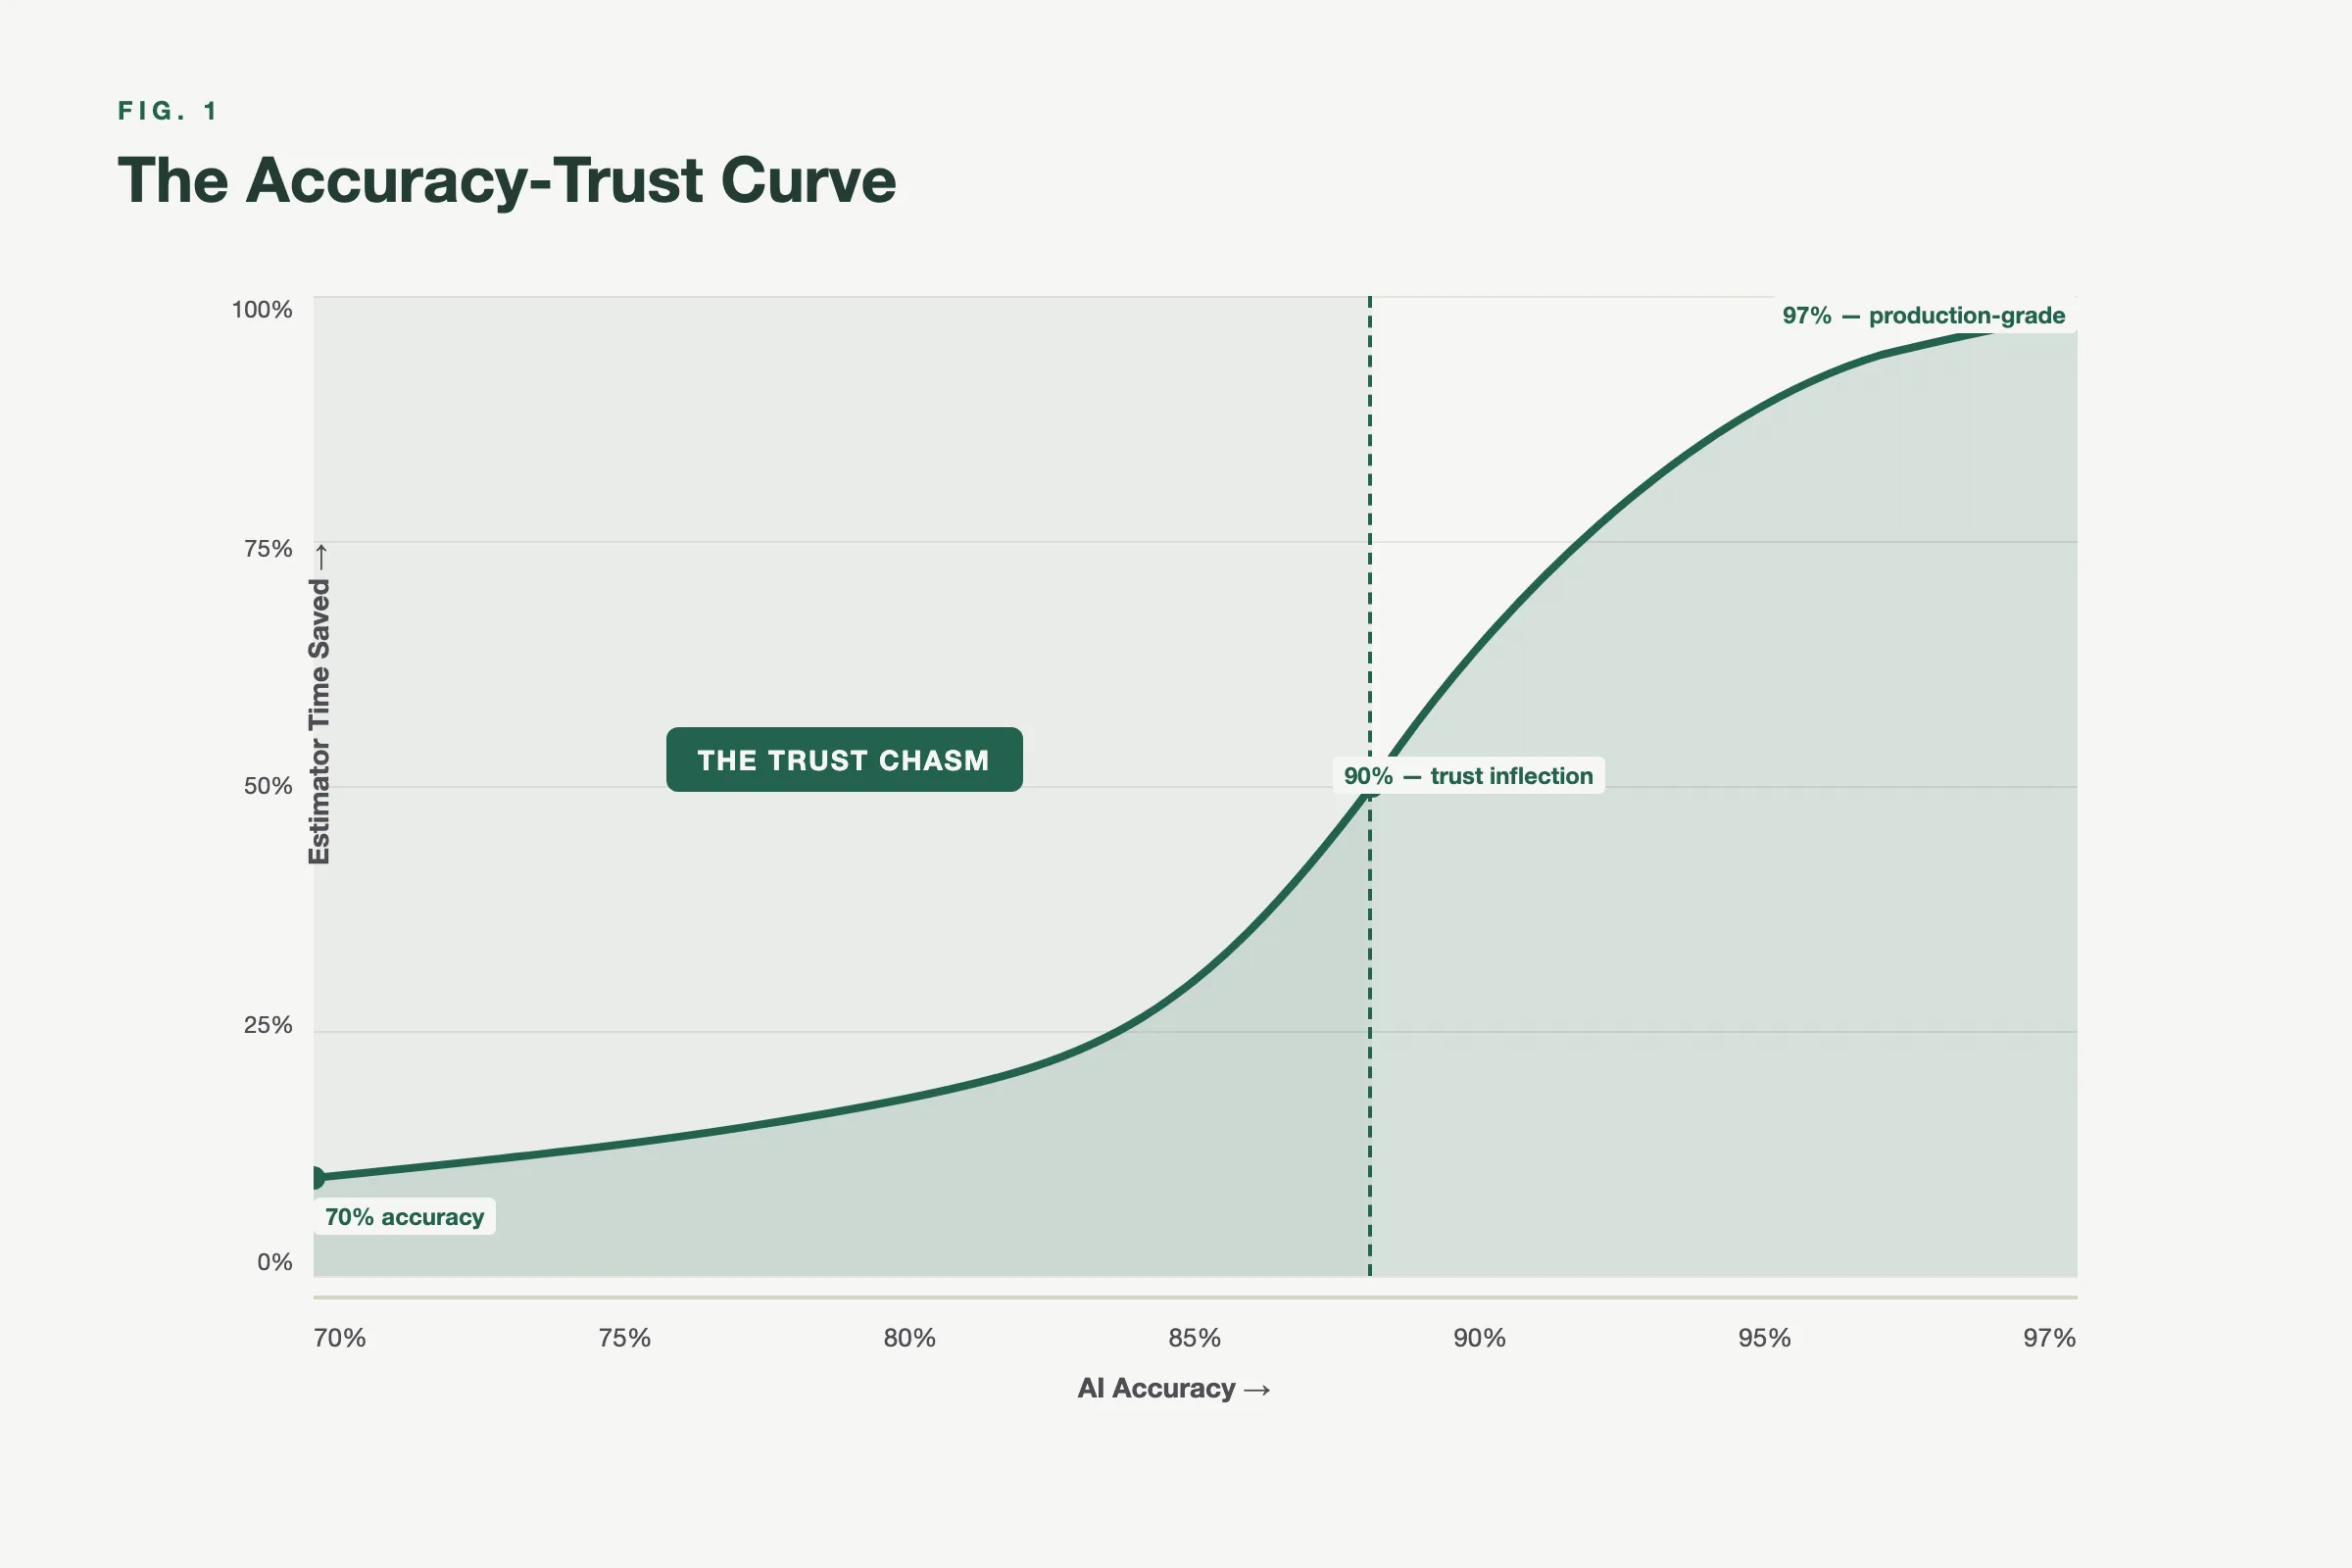
There’s a psychological cliff in construction estimation that we call the Trust Chasm.
Here’s how it works. When an AI tool delivers 70% accuracy on a takeoff, estimators don’t save 70% of their time. They save almost nothing. Because at 70%, you’re checking everything anyway. The mental overhead of verifying every output, wondering what was missed, second-guessing counts, it negates the speed advantage entirely. You might as well have done it from scratch.
At 80%, something shifts slightly. Estimators start trusting portions of the output. Maybe the area measurements look right, so they focus their review on symbol counts. But they’re still manually scanning most of the drawings.
At 95%, the psychology flips completely. Now you’re doing spot checks, not full reviews. You’re scanning for edge cases, not validating basics. The AI output becomes the starting point, not the thing you’re double-checking against your own work. Correcting 5% feels trivial. The conversation shifts from “is this right?” to “how fast can I send the bid?”
This isn’t theory. We watched it happen with real customers.
Where Our Models Actually Stand: Real F1 Scores
We publish this because nobody else in construction AI does.
These are benchmarked F1 scores from our MLflow evaluation runs, measured against human-annotated ground truth. Not cherry-picked demos. Not self-reported accuracy on hand-selected drawings. Production model evaluations.
Structural steel is our most mature trade. Steel beam line detection runs at F1 0.93-0.95 end-to-end, with beam label classification at 99.6% accuracy. Beam centerline extraction hits F1 0.94. Brace detection: F1 0.92.
Mechanical HVAC fittings detection (elbows, dampers, GRDs, flex ducts) is at F1 0.84 combined. GRD subtype classification reaches F1 0.91. Individual components vary: GRD supply detection at F1 0.80, flex duct detection at F1 0.72.
Ceiling and area segmentation is where the numbers are highest: F1 0.997 on region classification, IoU 0.995. This is the closest thing to “solved” in our stack.
Architectural door detection sits at F1 0.88. Page region classification at F1 0.97.
Electrical devices are the hardest: F1 0.64 on the full detection pipeline, though mAP@50 reaches 0.81. This is where the most active model improvement work is happening.
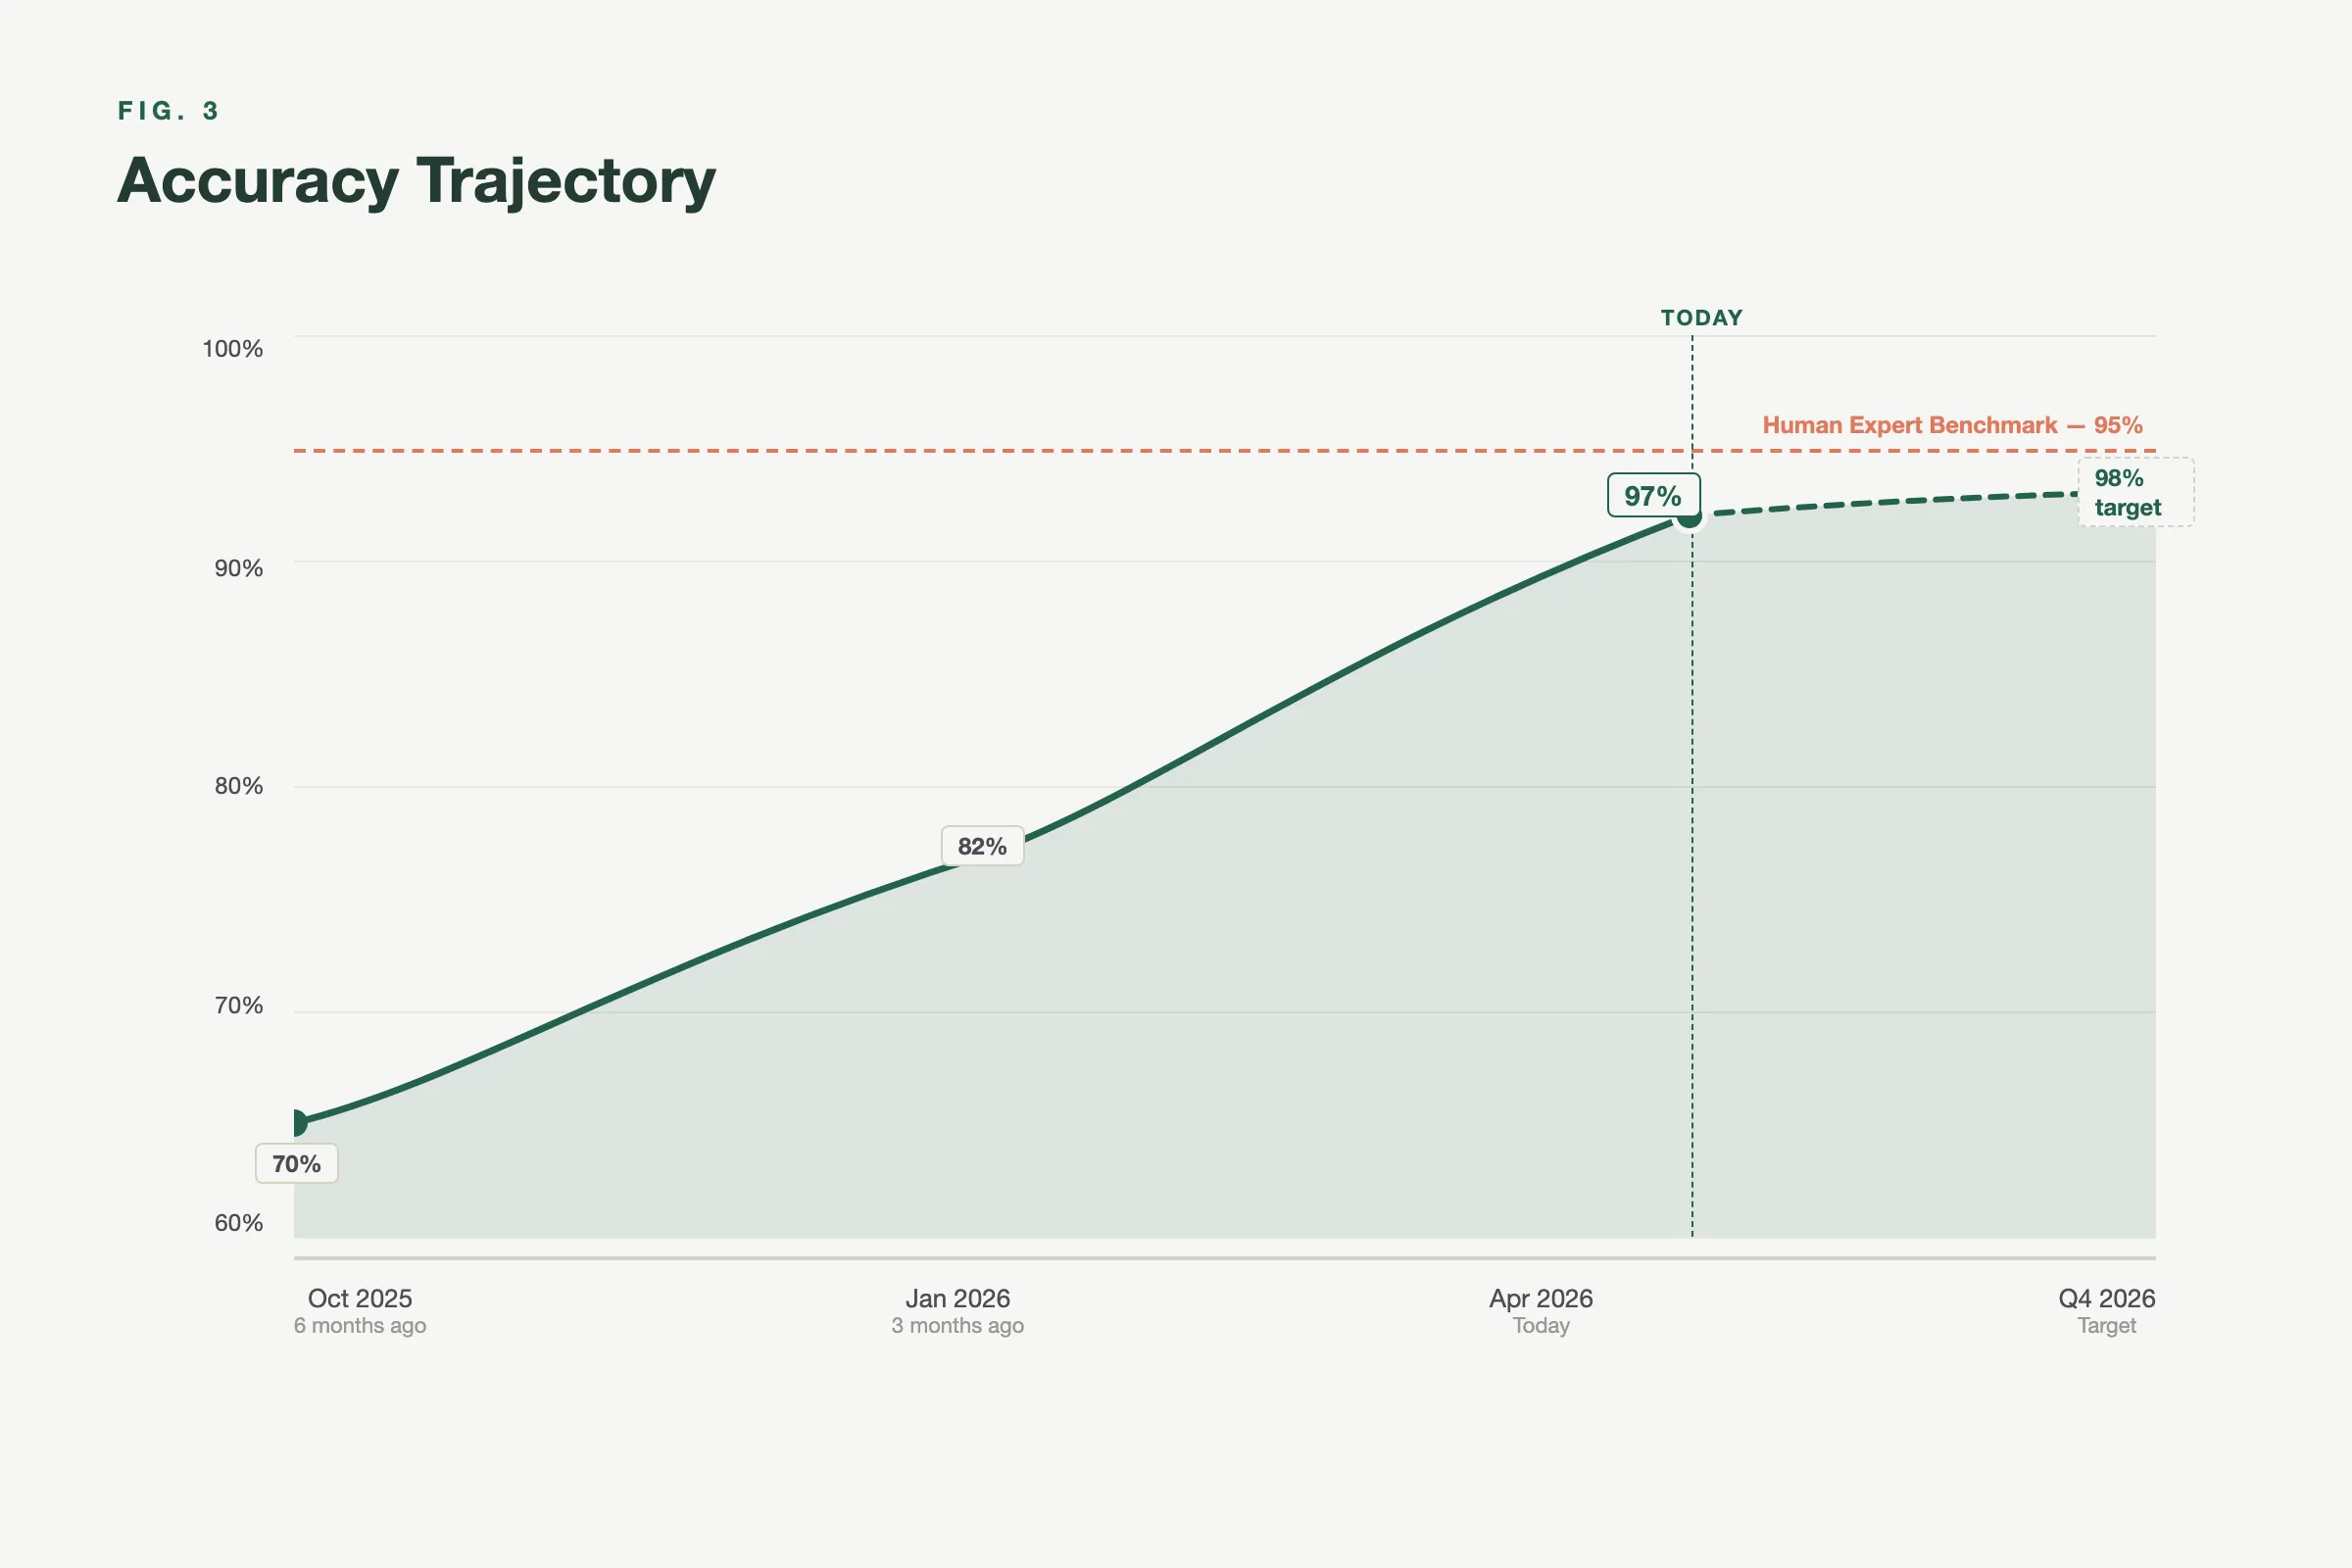
The honest summary: our best models exceed 95% F1. Our weakest are in the 60-70% range. The average across production models sits in the mid-80s. Six months ago, most of these numbers were 15-25 points lower.
How did they move that far? Not by fine-tuning a single model harder. The jump came from rethinking the problem structure entirely.
Stage 1: Recognizing That Detection Isn’t Understanding
Early versions of our pipeline treated construction drawings as image recognition problems. Run a model over the page, detect symbols, count them, done.
This fails catastrophically on real drawings because construction documents aren’t photographs. They’re layered technical compositions: geography, symbols, legends, schedules, annotations, stamps, revision notes, and legal text stacked on top of each other. The information you need is buried under 70 to 80 percent visual noise.
A single-pass model tries to understand all of this simultaneously. And it can’t. Not reliably.
Stage 2: Agentic Vision, Many Decisions Instead of One Guess
The breakthrough came when we stopped asking models to “understand the image” and started asking them to decide what to look at next.
We rebuilt our vision pipeline around a multi-stage, agentic approach:
- Isolate relevance. The system identifies and suppresses noise (schedules, tables, stamps, extraneous text) using bounding boxes.
- Crop intentionally. Instead of processing the full image, the system crops to the region that contains the actual diagram.
- Decompose the task. Rather than detecting everything at once, the system breaks the problem into smaller units: identify symbol classes, count instances per class, localize each instance.
- Parallelize reasoning. Each sub-problem runs independently. The system composes an answer instead of guessing one.
This is the difference between recognition and reasoned perception.
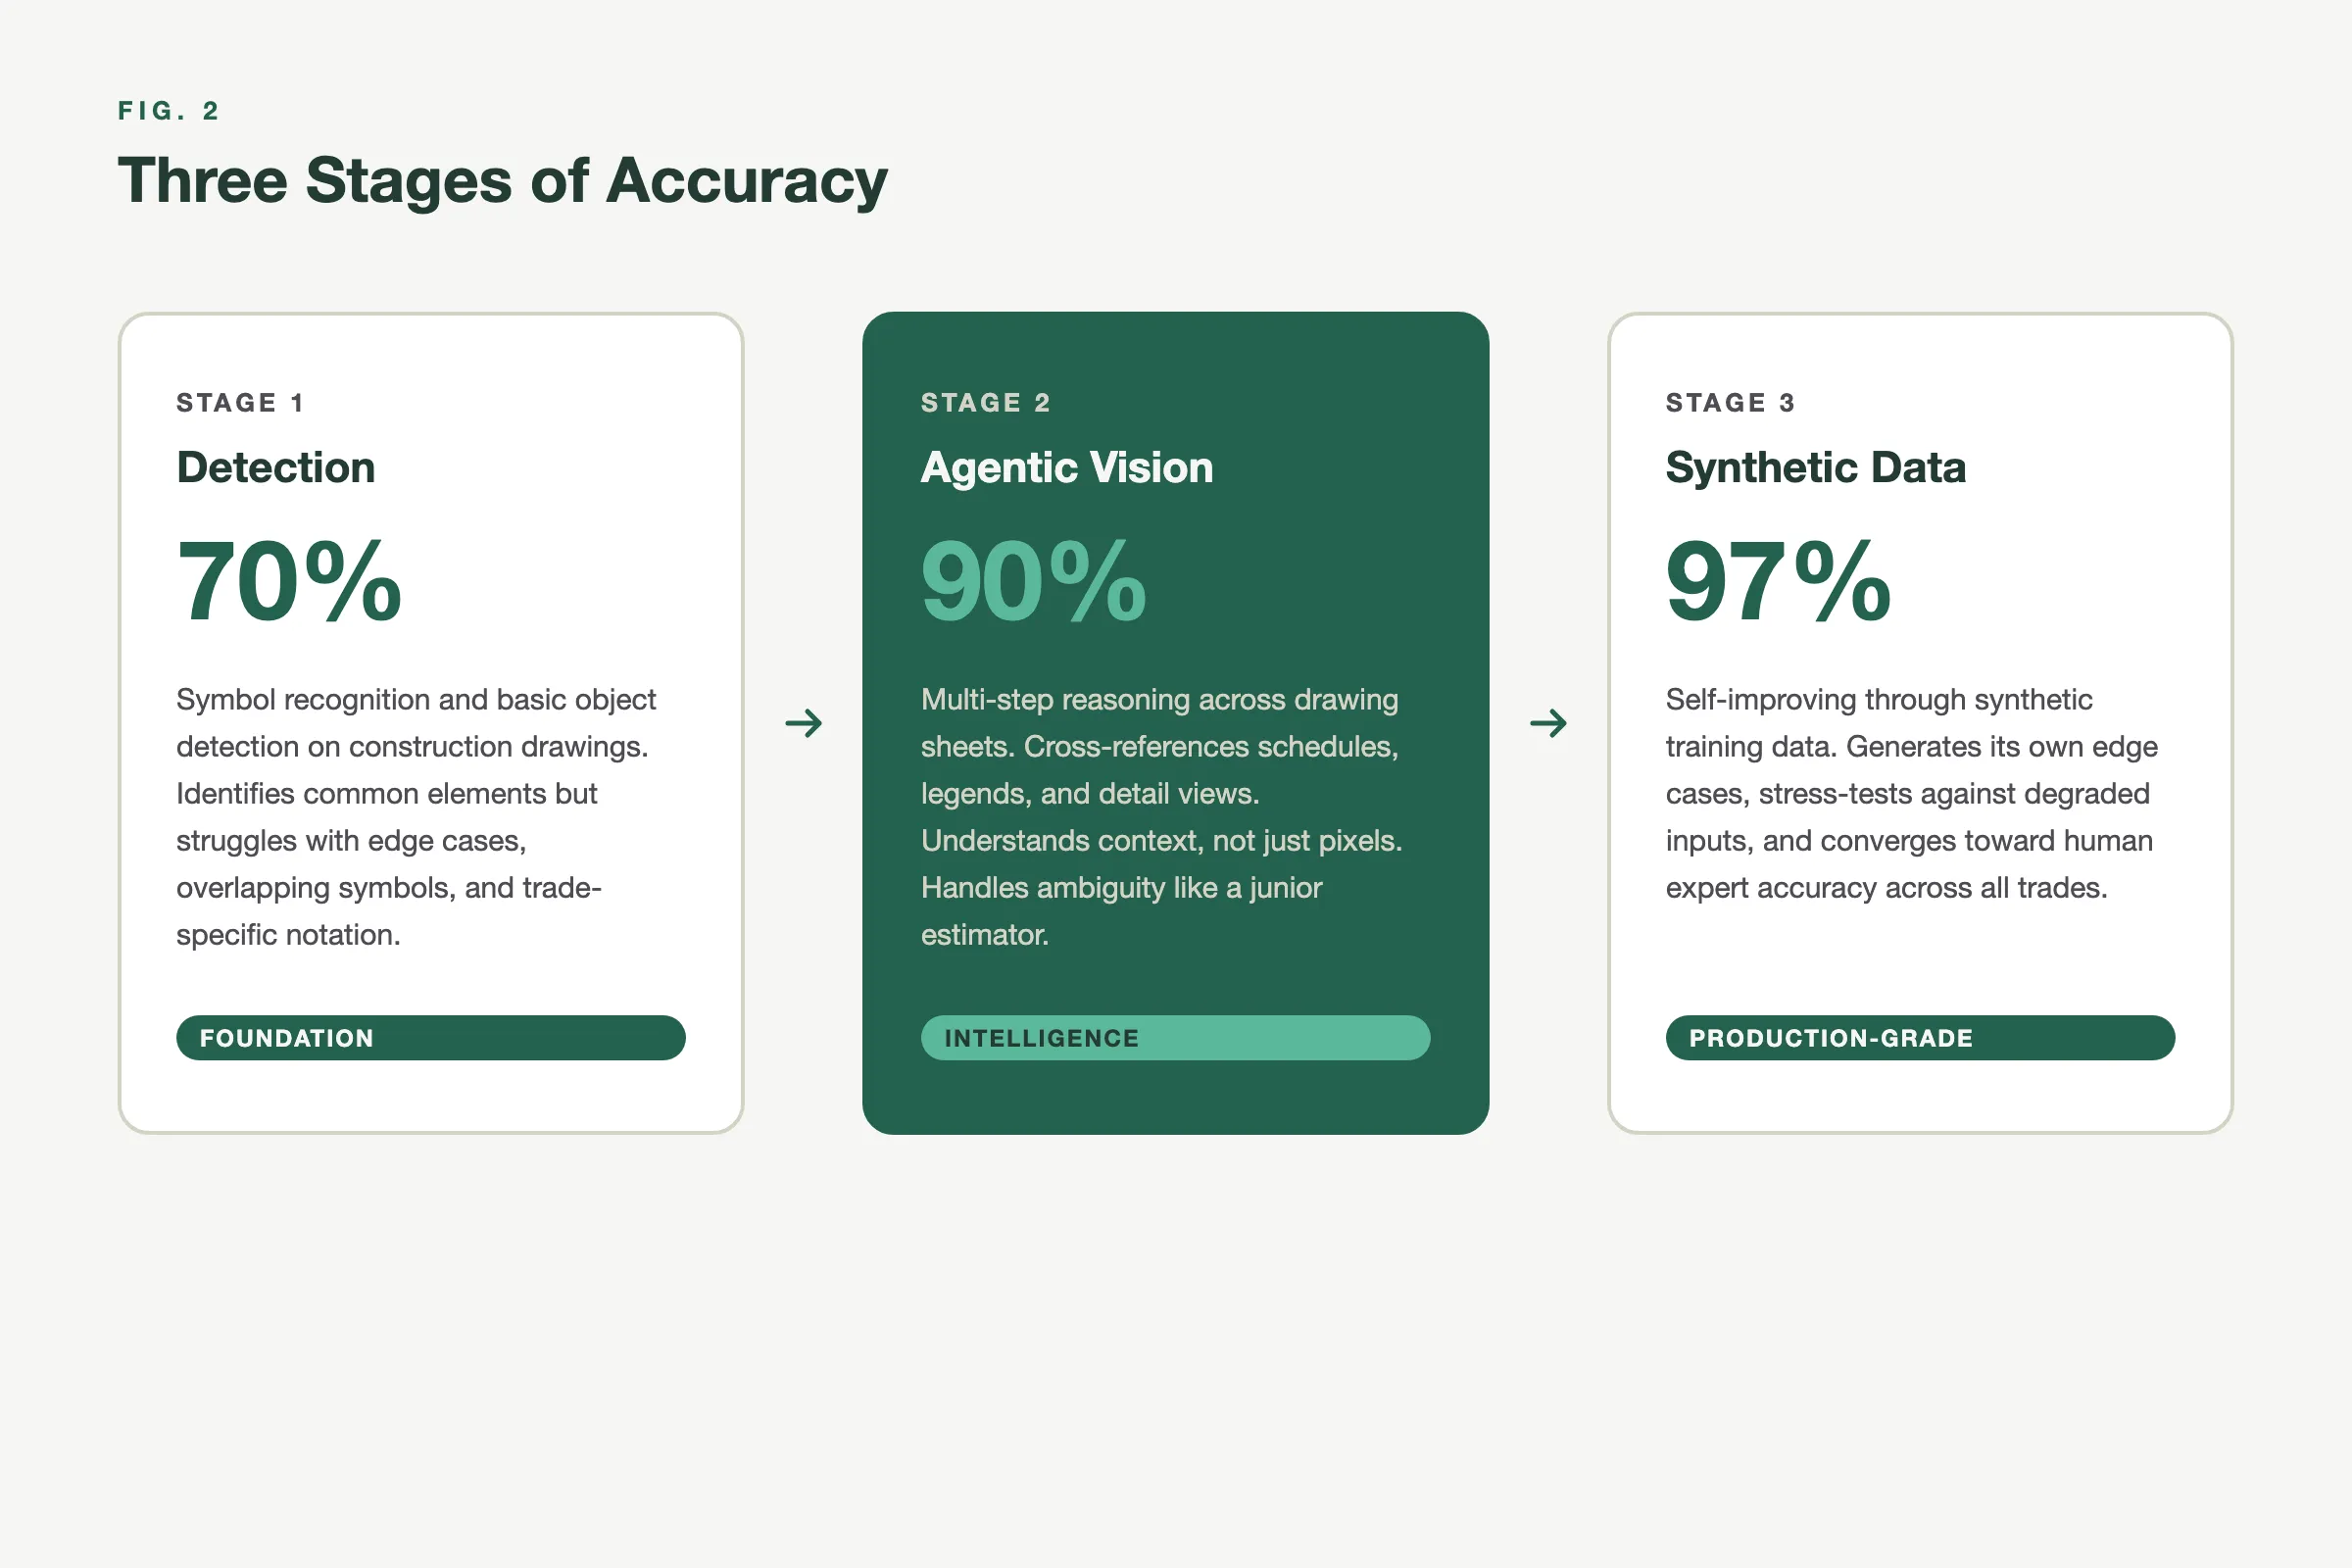
Stage 3: The Synthetic Data Factory
Here’s what most AI companies in construction won’t tell you: the real constraint on accuracy isn’t model architecture. It’s training data.
Construction drawings are wildly heterogeneous. Every architect has different conventions. Every trade has different symbol sets. Sheet quality ranges from crisp CAD exports to fourth-generation scanned copies that look like they survived a flood.
You can’t fine-tune your way through this with a few hundred examples. The distribution is too wide.
So we built a synthetic data pipeline. Our generator produces thousands of edge-case blueprints per hour: unusual symbol placements, degraded image quality, overlapping annotations, non-standard legends. These synthetic drawings fill the gaps in our training distribution that real-world data collection could never cover fast enough.
The trajectory is clear. With this pipeline running, our strongest trades (structural steel, ceiling segmentation) already exceed F1 0.93. The goal is to bring every trade above 0.90 by Q4 2026. Some, like electrical device detection, have further to go than others. We’re honest about that because accuracy is the only metric that earns trust.
Why This Matters for Construction, Not Just for Boon
The Trust Chasm isn’t a Boon problem. It’s an industry problem.
Construction is one of the last major industries where the core knowledge work (estimation, takeoff, quantity surveying) is still done primarily by humans with software that hasn’t fundamentally changed in twenty years. The tools got faster. They didn’t get smarter.
AI changes that equation, but only if the accuracy crosses the trust threshold. Below it, AI is a toy that estimators tolerate during demos and ignore in practice. Above it, AI becomes infrastructure that firms build their workflows around.
The companies that cross that line first will compound their advantage. Every project processed generates training data. Every customer interaction reveals edge cases. Every correction feeds back into the models. Accuracy improves, which drives adoption, which generates more data, which improves accuracy further.
It’s a flywheel, and it only spins if you’re above the trust threshold.
The Metric That Replaces Vanity Numbers
If you’re evaluating construction AI, stop asking about “time savings.” That number is meaningless without accuracy context. A tool that does a takeoff in 30 seconds but gets 70% right hasn’t saved you any time at all.
Ask instead:
- What is the measured accuracy against human-annotated ground truth? Not self-reported. Benchmarked.
- How is accuracy trending over time? Static means the company has hit a ceiling. Improving means the flywheel is working.
- What is the error convergence trajectory? Where is accuracy heading, and what’s the roadmap to get there?
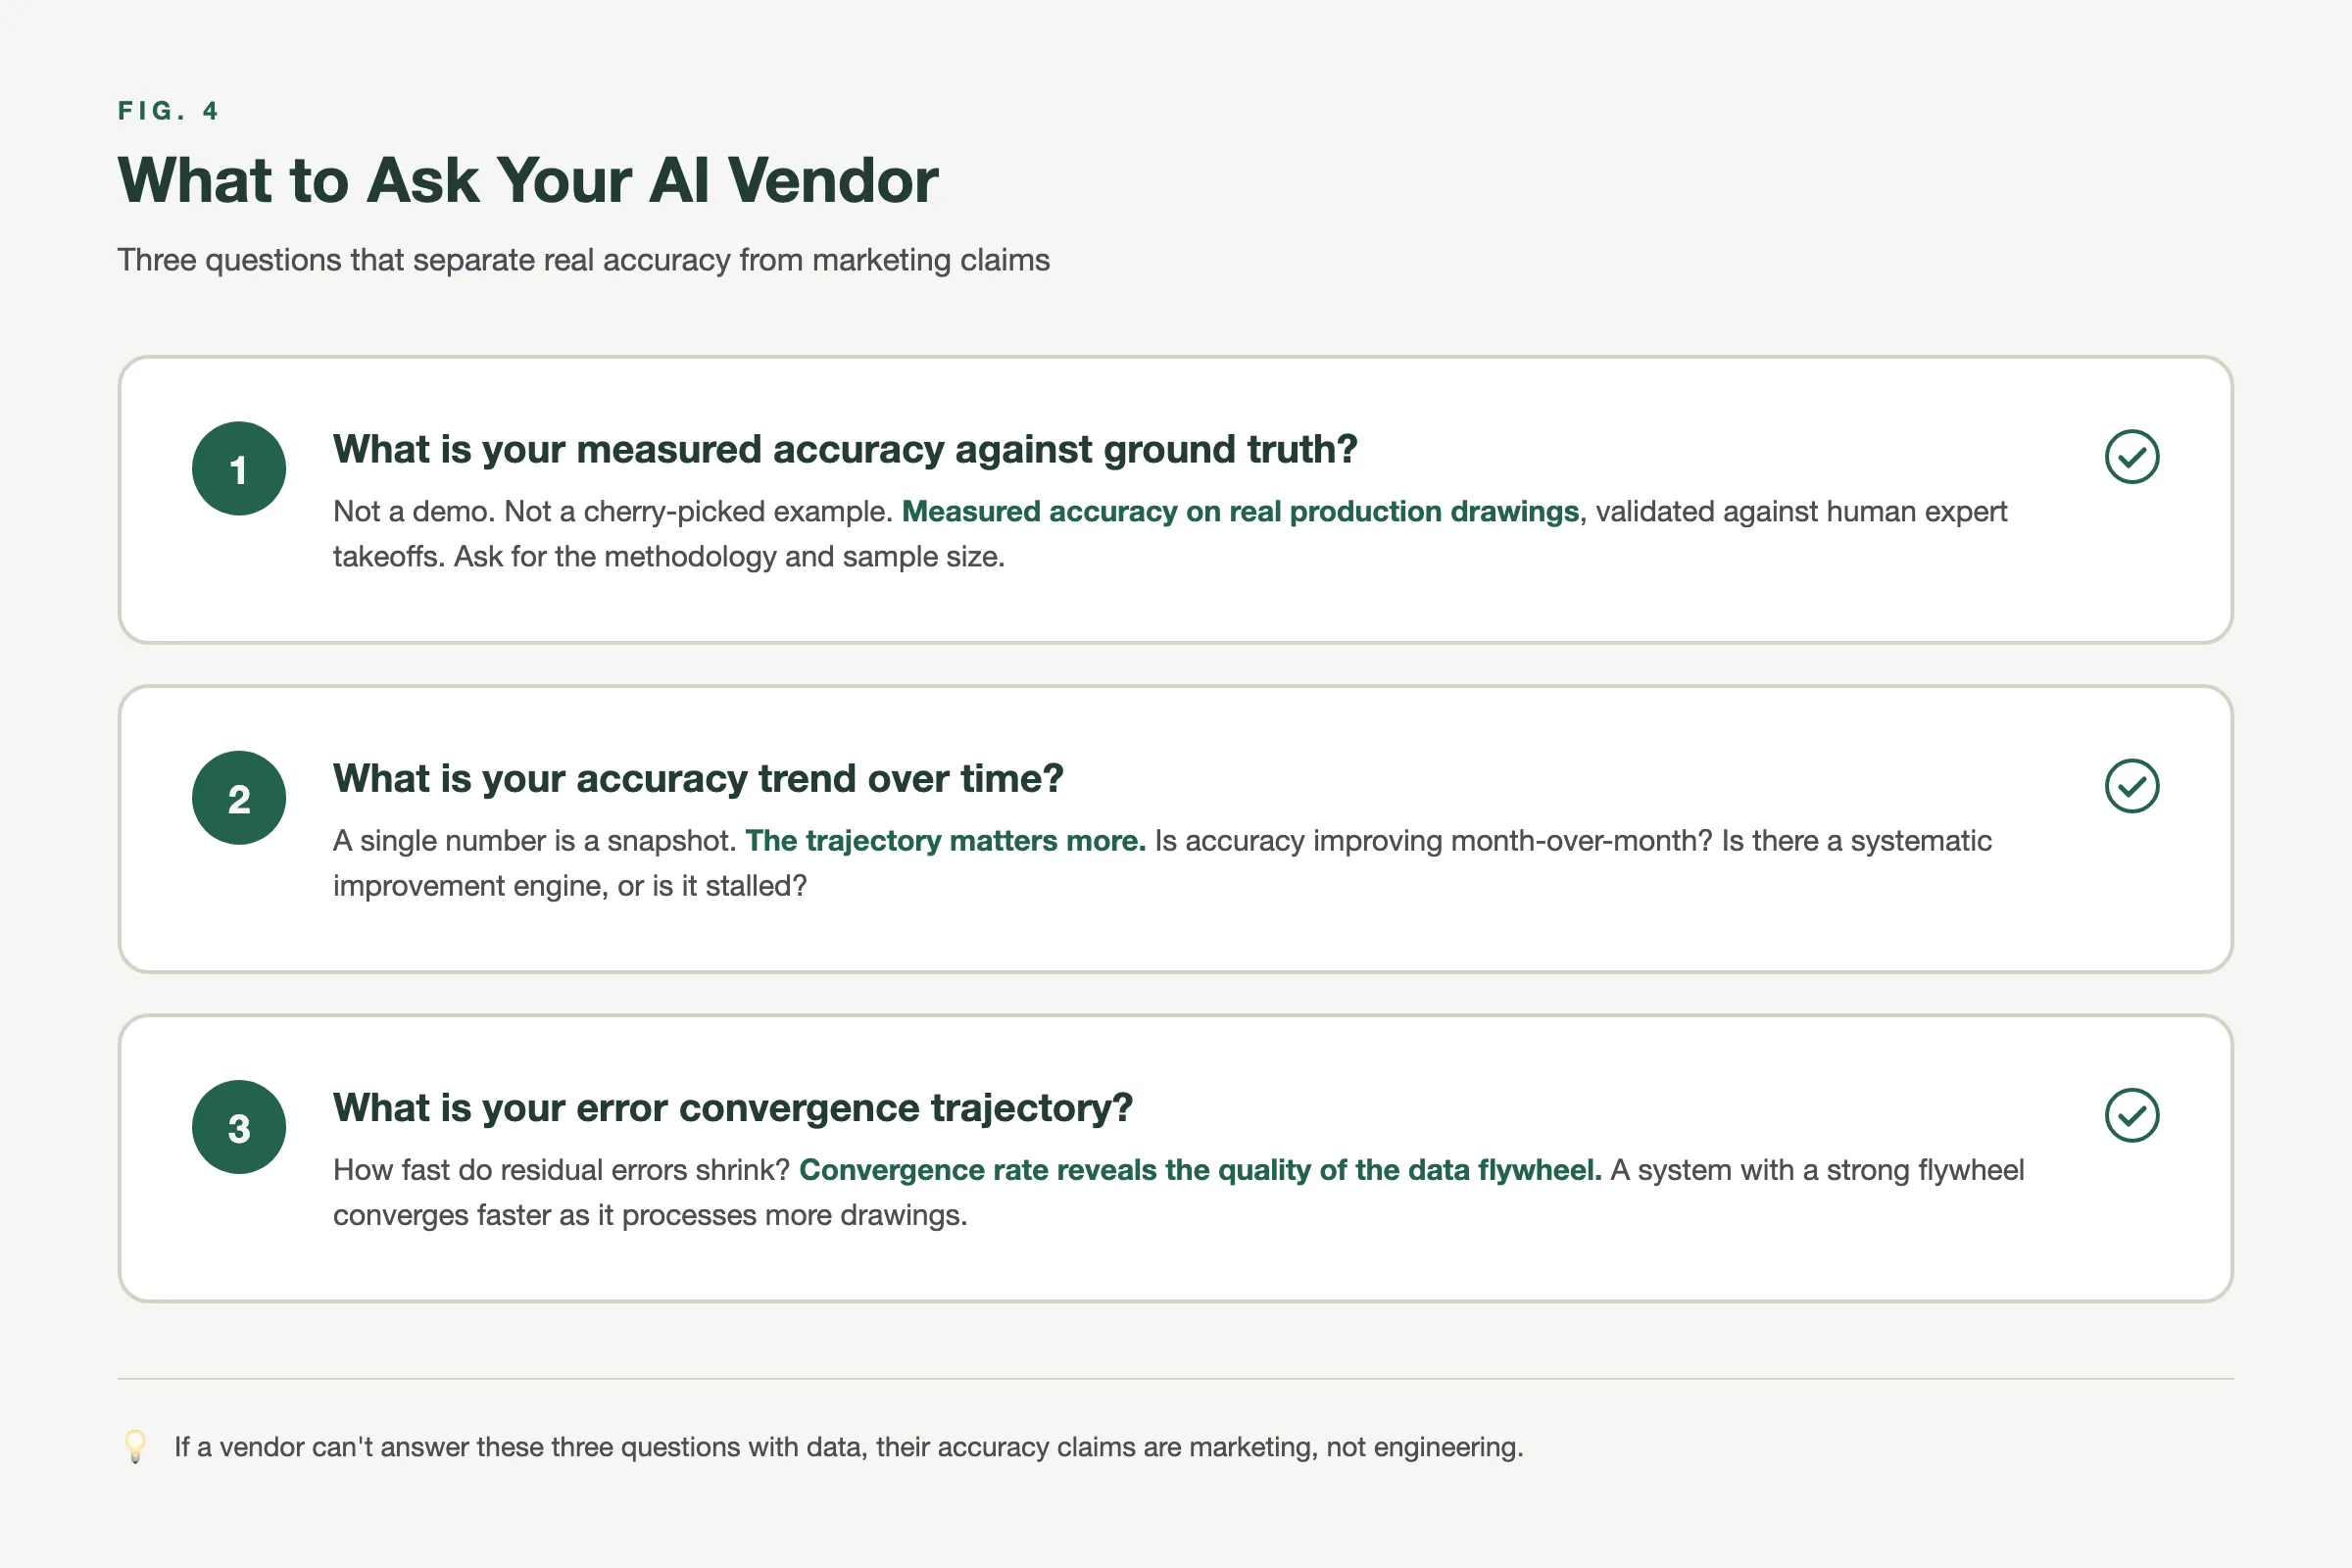
These are the metrics that separate tools from platforms, demos from production systems, and the companies that will still be here in three years from the ones that won’t.
Boon’s production models range from F1 0.64 (electrical device detection, our hardest problem) to F1 0.997 (ceiling segmentation). Structural steel beam detection runs at F1 0.93-0.95. Mechanical HVAC fittings at F1 0.84. Every number is benchmarked against human-annotated ground truth in MLflow, and every number is improving.
If you want to see what trust-threshold accuracy looks like on your own drawings, book a demo.